Visualization
qqa.visualization offers consistent plotting helpers that accept a
backend="matplotlib" | "plotly" argument. Plotly requires the optional
extra pip install qqa[plotly]; missing plotly automatically falls back to
matplotlib with a warning.
Catalog
from qqa import visualization as viz
viz.plot_history(result) # loss / penalty / diversity
viz.plot_best_trajectory(result) # best objective over epochs
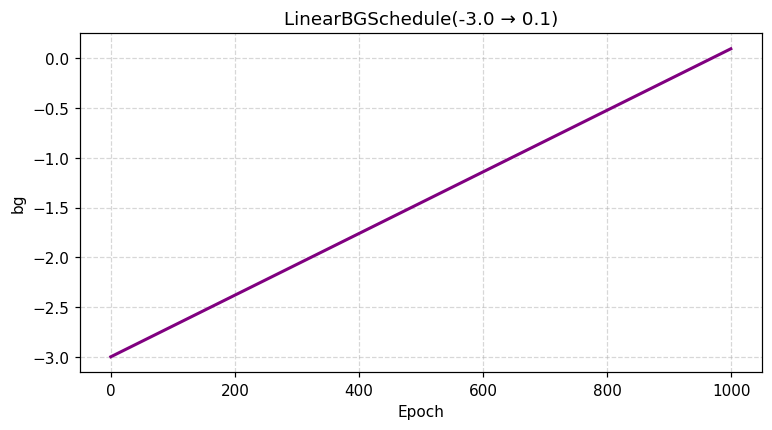
viz.plot_schedule(schedule, num_epochs) # bg annealing schedule
viz.plot_run_comparison(results, labels=[...])
viz.plot_parallel_coordinates(df, objective="best_obj", backend="plotly")
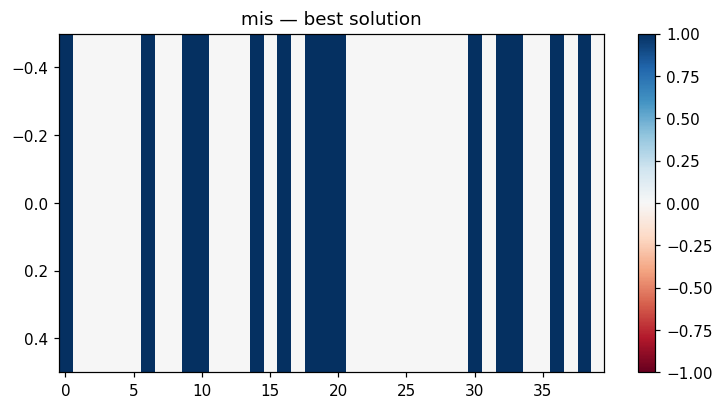
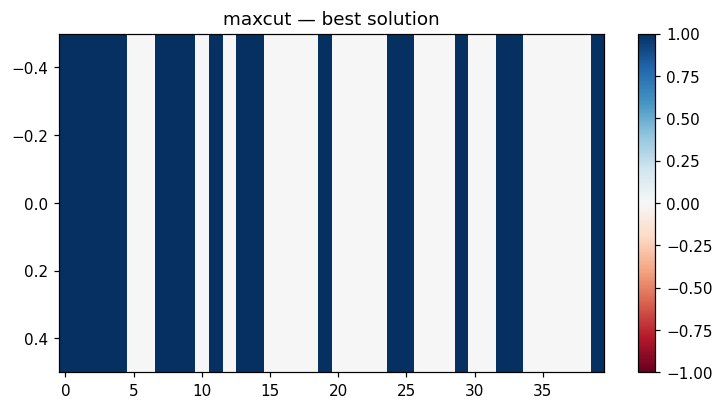
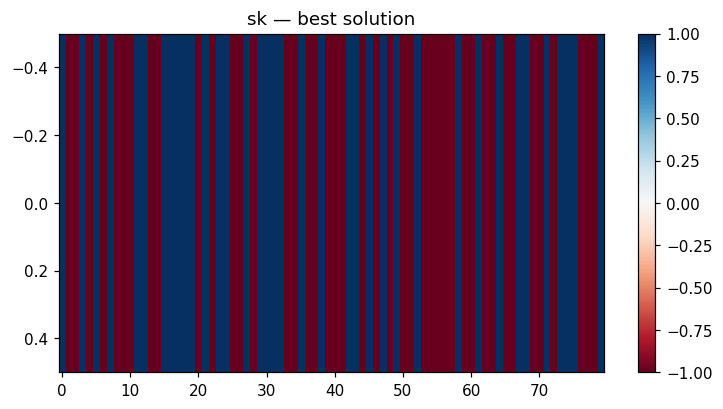
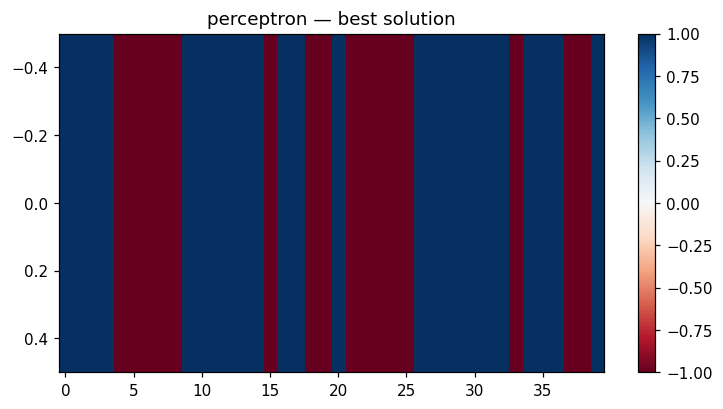
viz.plot_solution_heatmap(result, problem)
Example: compare multiple runs
import qqa
from qqa import visualization as viz

problem = qqa.SherringtonKirkpatrick(N=80, seed=0)
runs = [
    qqa.anneal(problem, num_epochs=600, min_bg=-3, verbose=False),
    qqa.anneal(problem, num_epochs=600, min_bg=-1, verbose=False),
]
viz.plot_run_comparison(runs, labels=["min_bg=-3", "min_bg=-1"])
Integration with dashboards
All Plotly figures are raw plotly.graph_objects.Figure instances, so
they drop straight into st.plotly_chart(fig).
Gallery
Figures below are regenerated deterministically by
scripts/make_gallery.py. The full set (eight problems × four plot kinds
plus the annealing schedule) lives under data/fig/gallery/ and is
referenced from the top-level README. The MkDocs site loads the PNGs
directly from GitHub's raw endpoint so the canonical copies stay in
data/ without duplication inside docs/.
Schedule
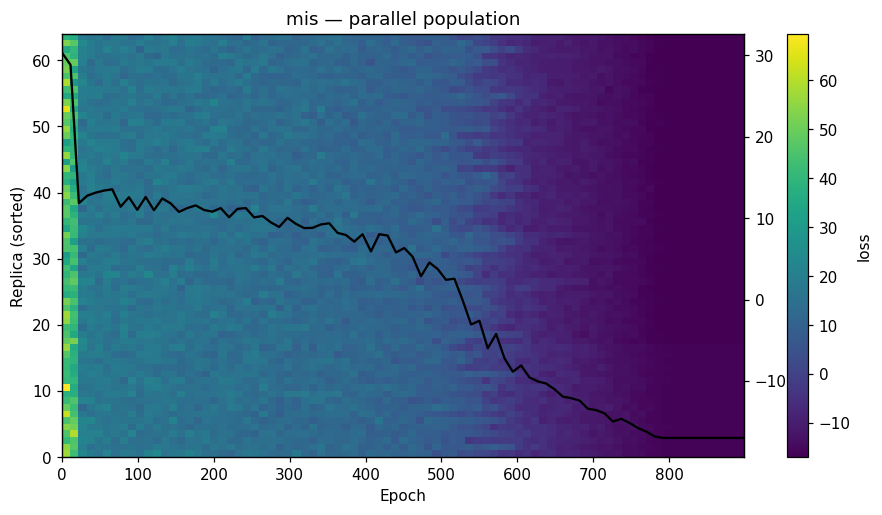
Per-problem dynamics
| Problem | History | Solution | Population |
|---|---|---|---|
| MIS | 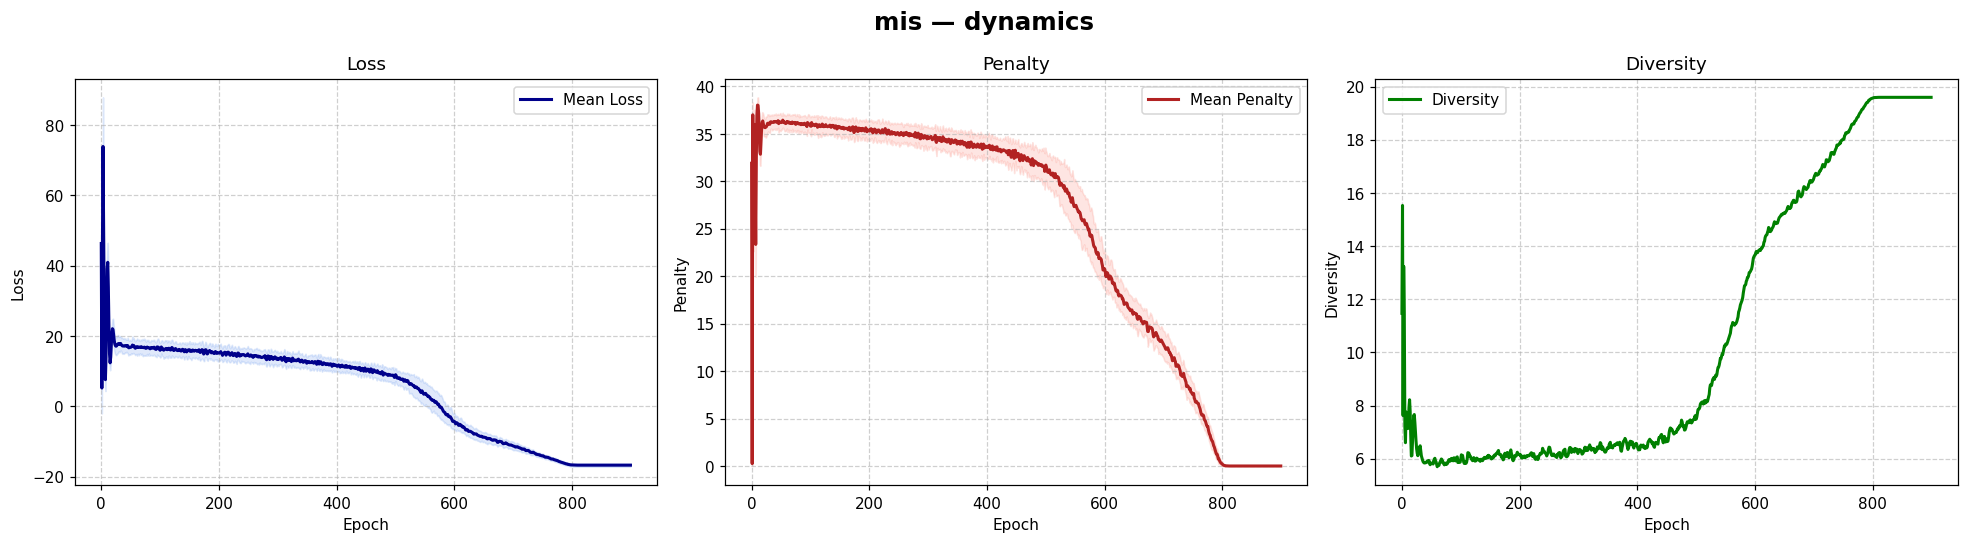 |
 |
 |
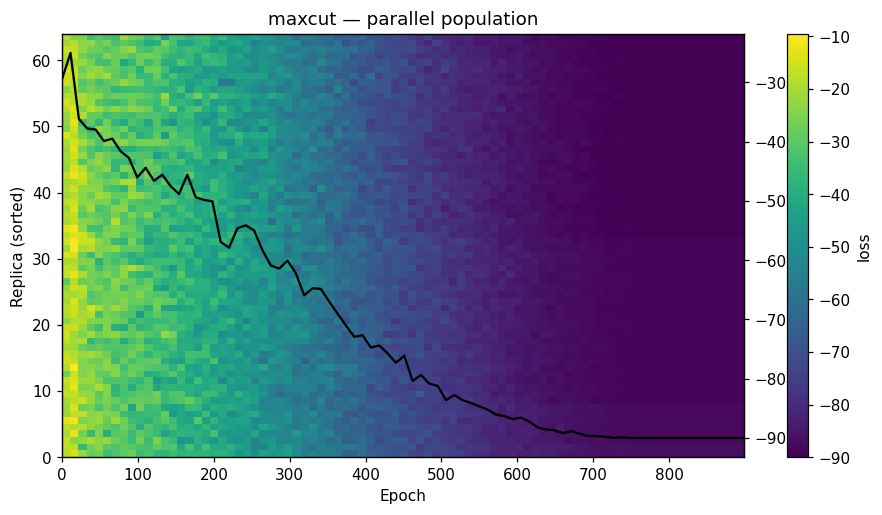
| Max-Cut | 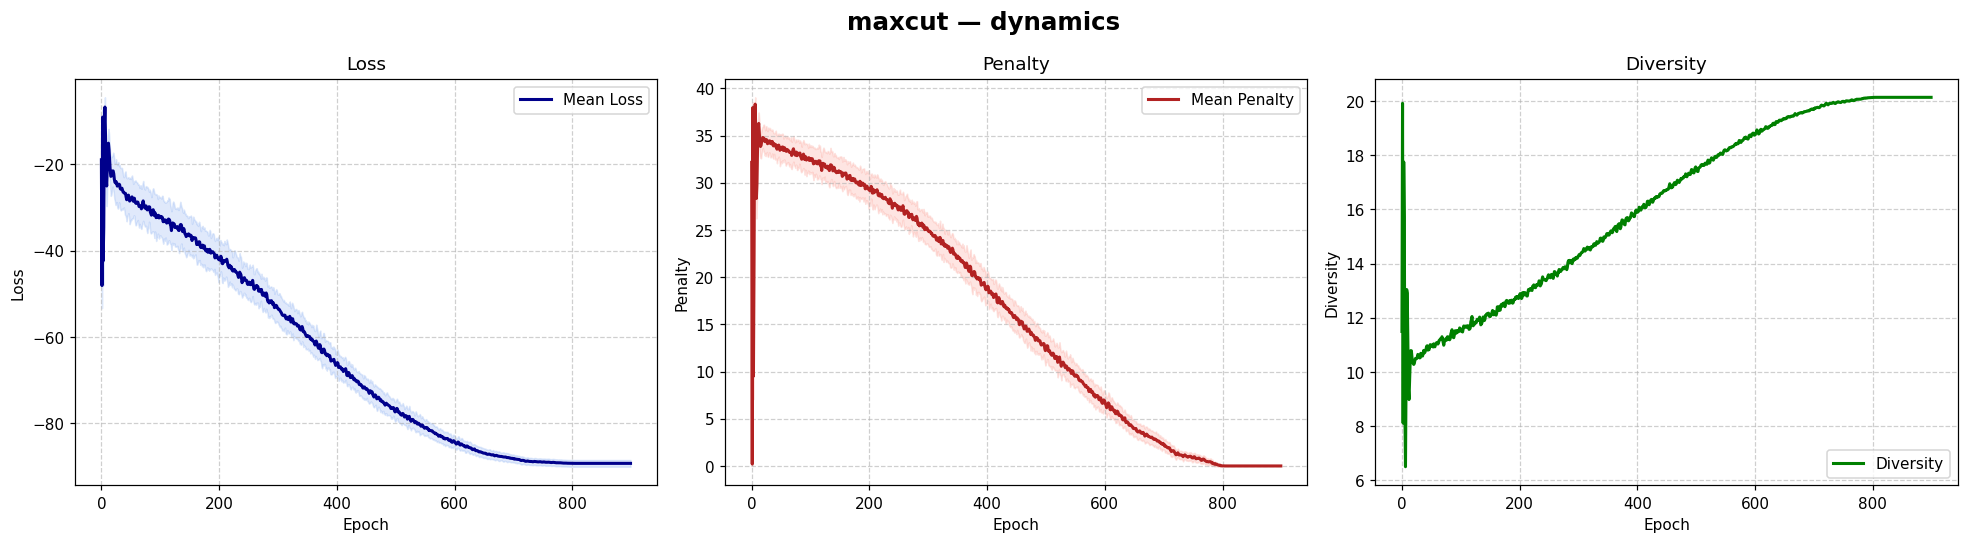 |
 |
 |
| Coloring | 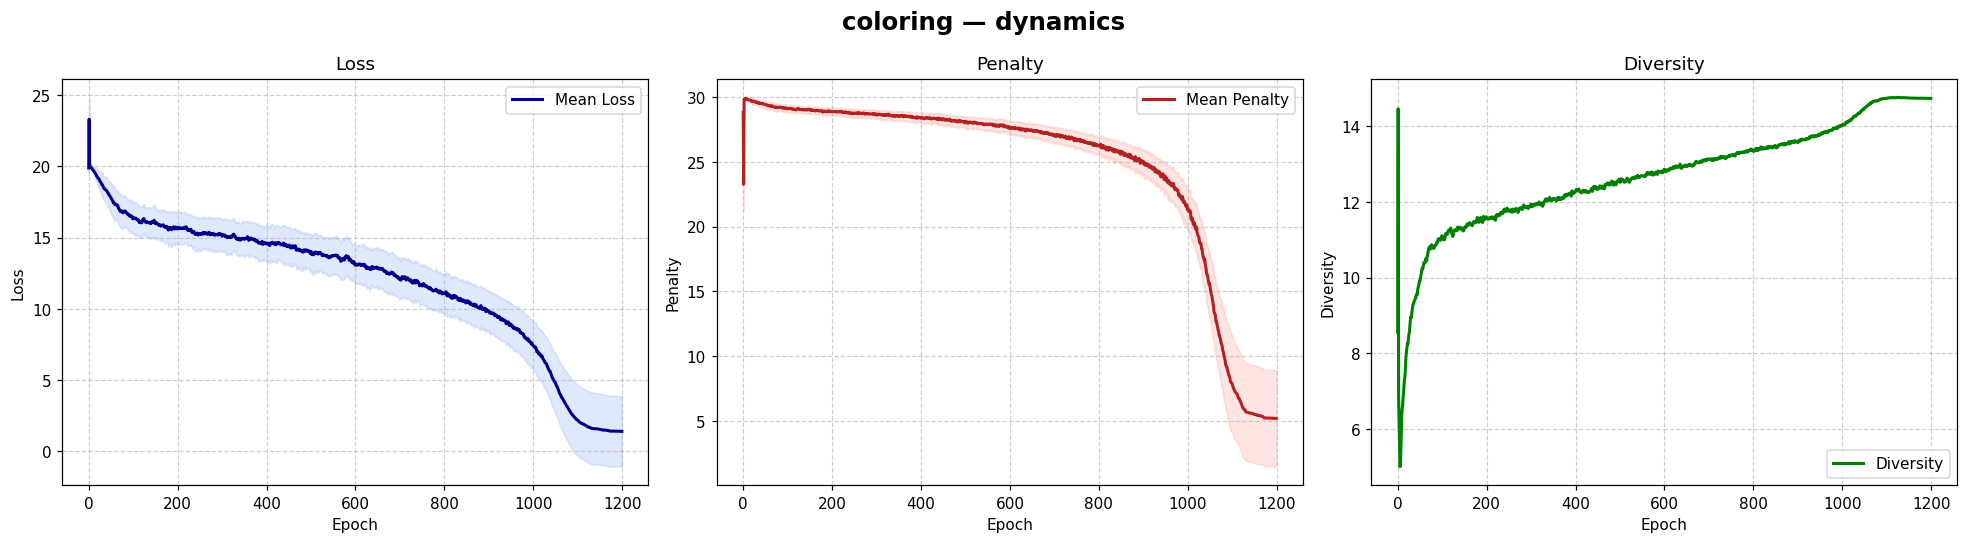 |
— | 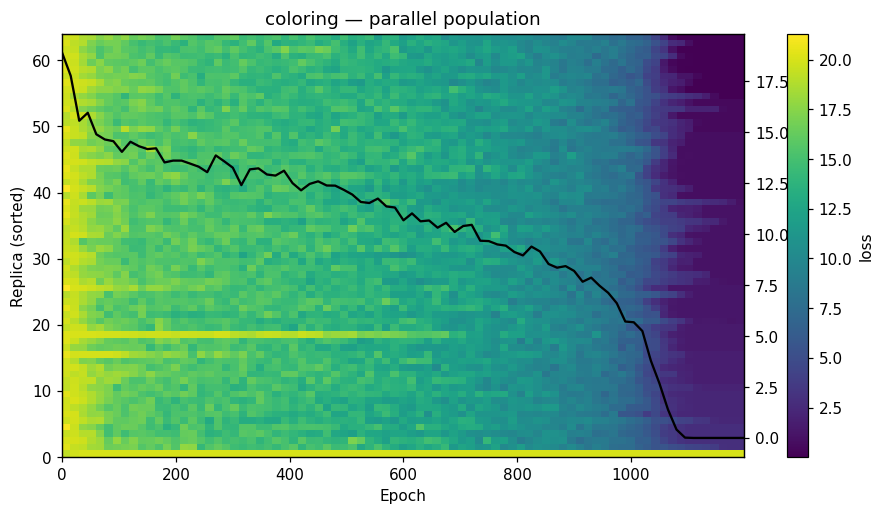 |
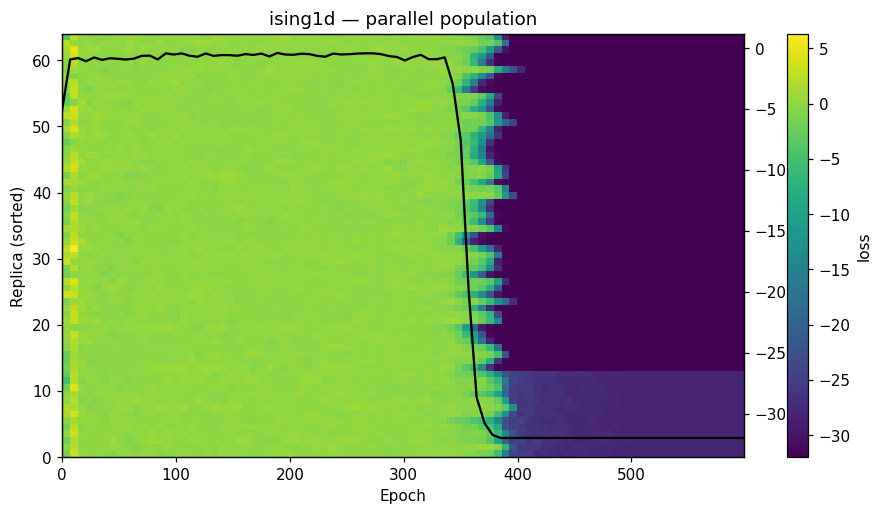
| Ising 1D | 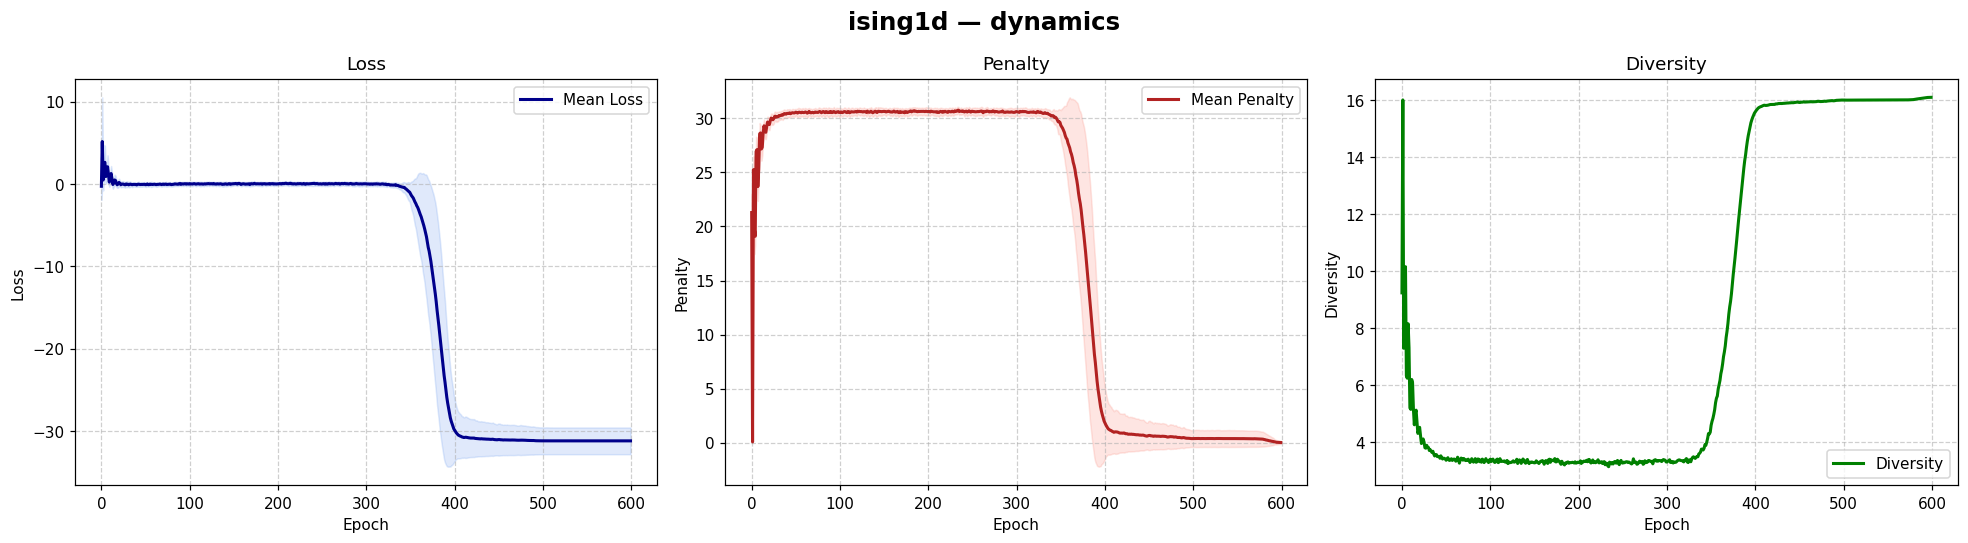 |
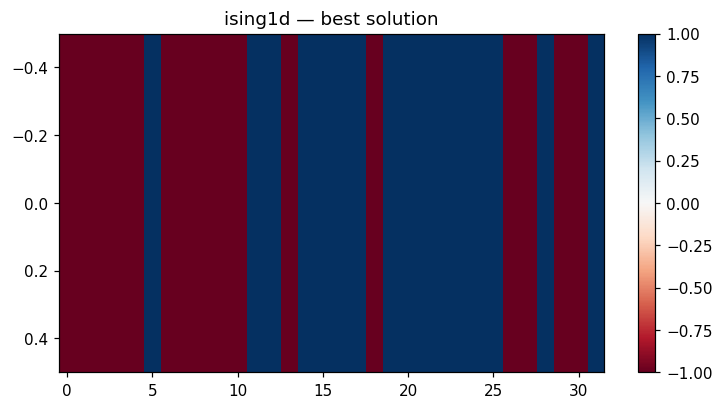 |
 |
| EA 3D | 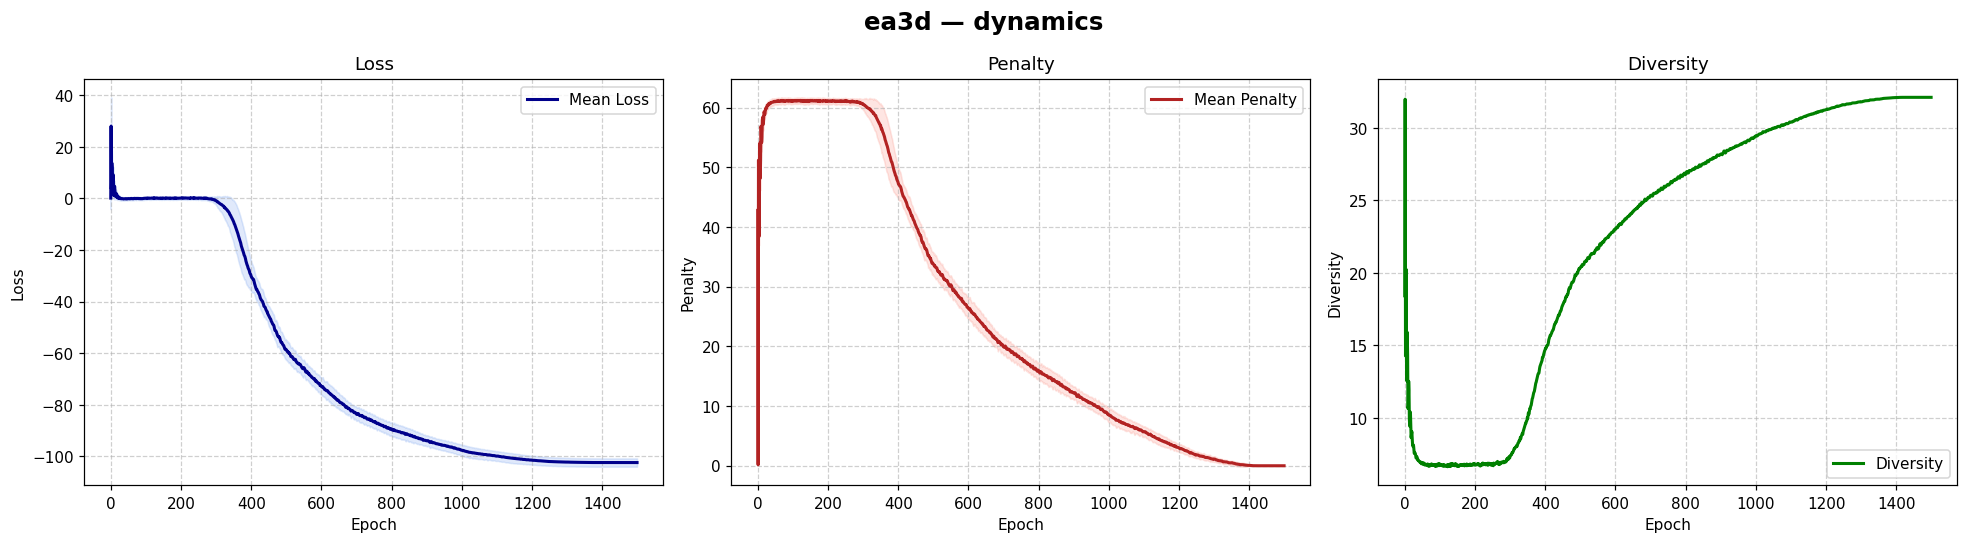 |
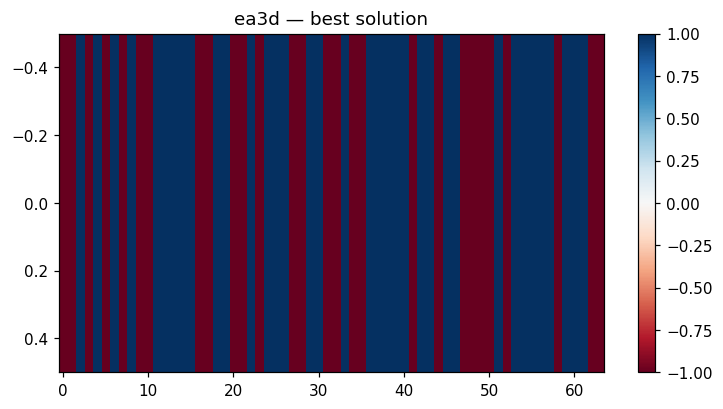 |
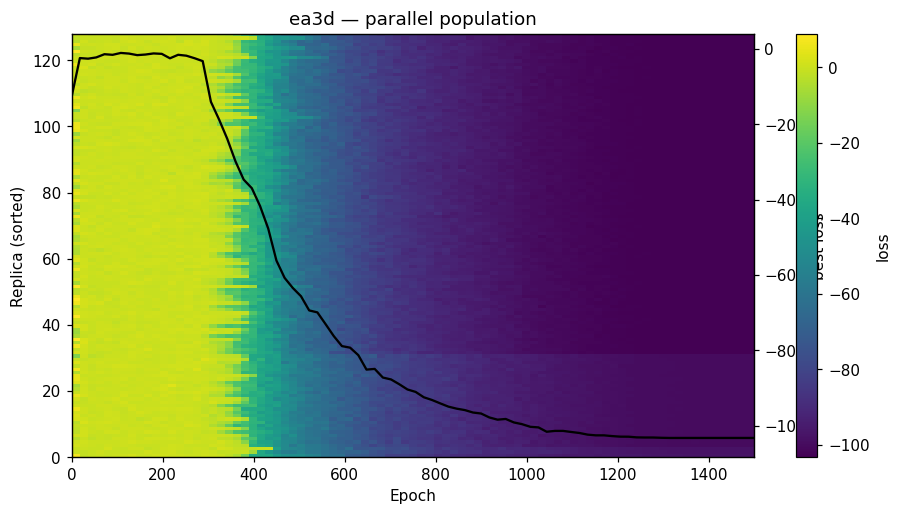 |
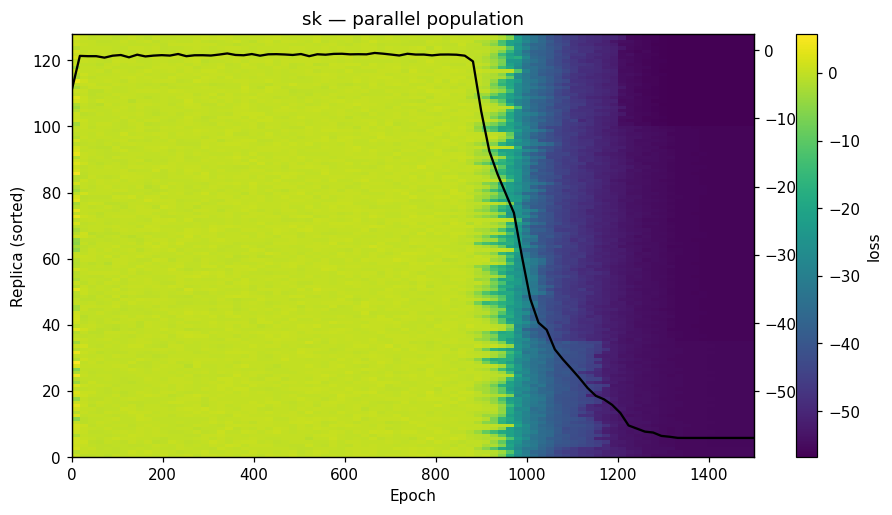
| SK | 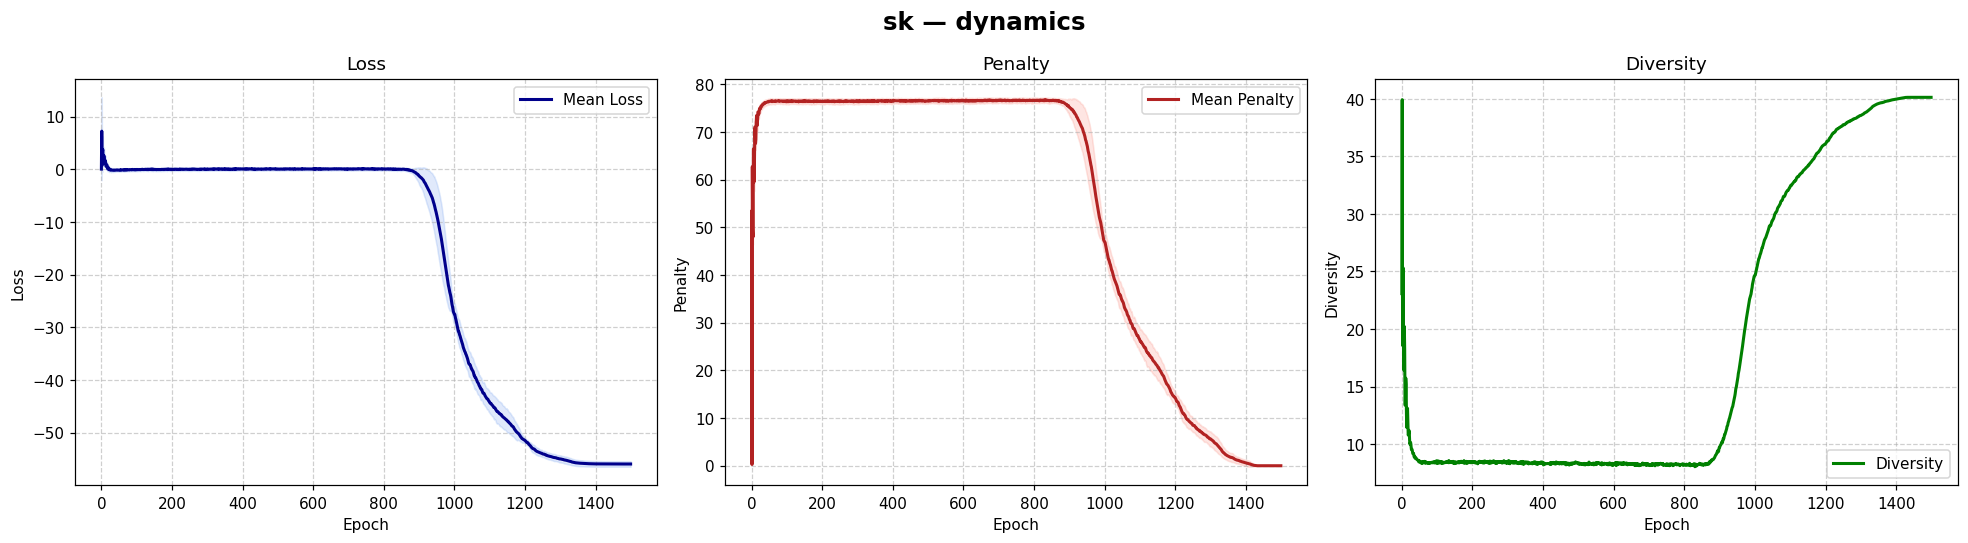 |
 |
 |
| Perceptron | 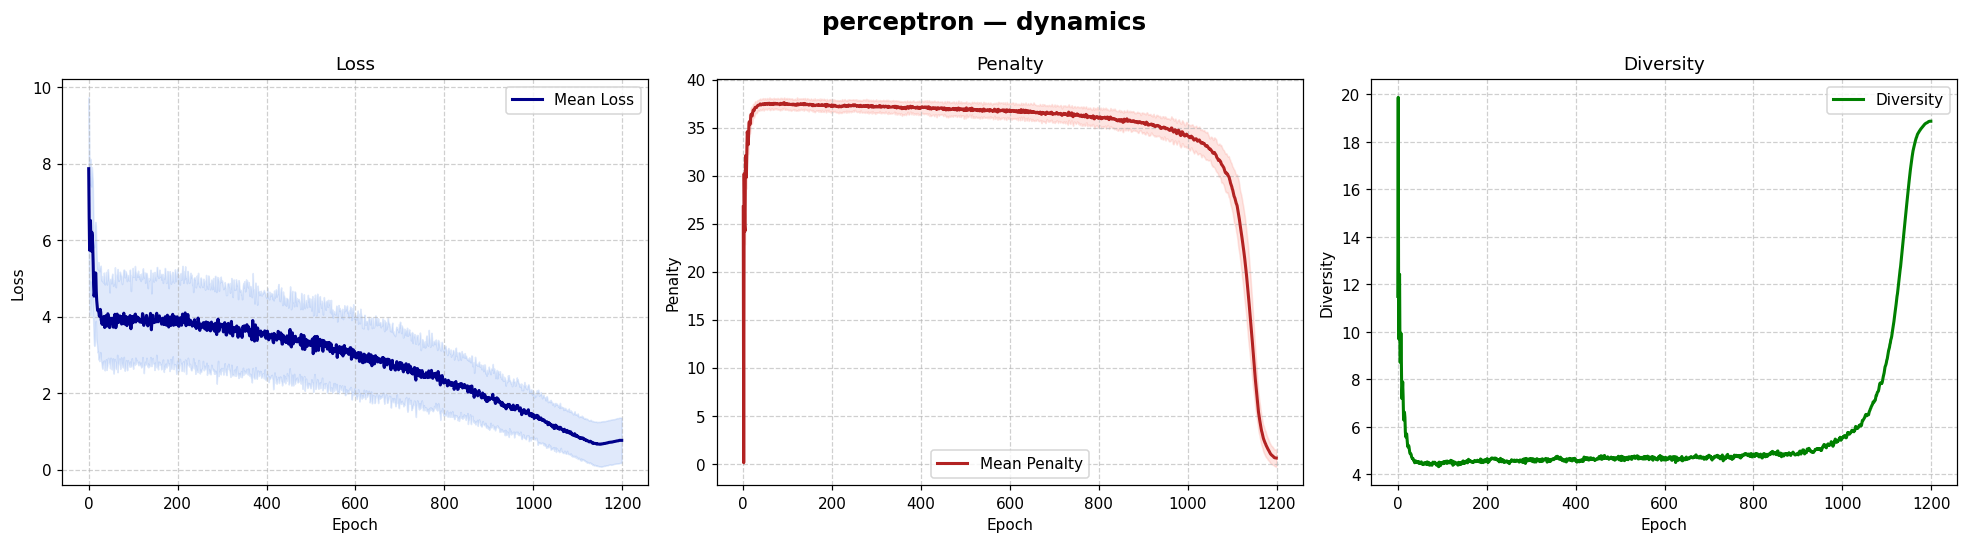 |
 |
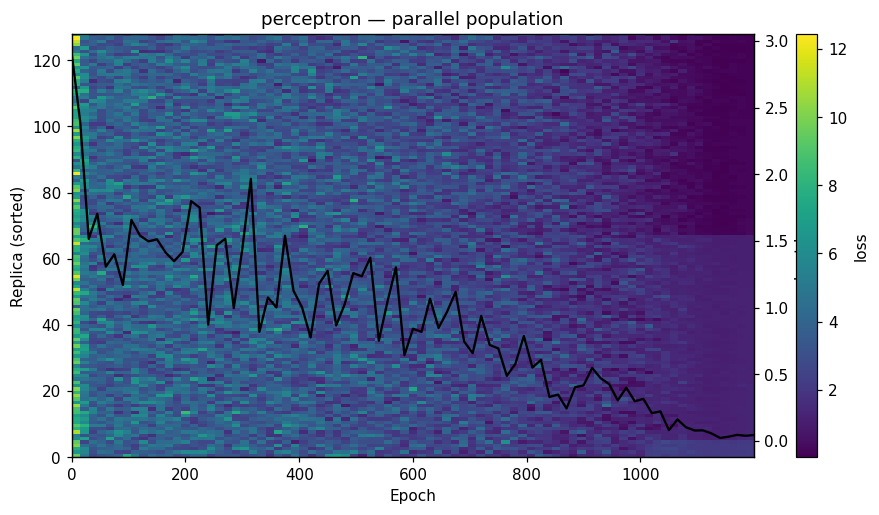 |
| Hopfield | 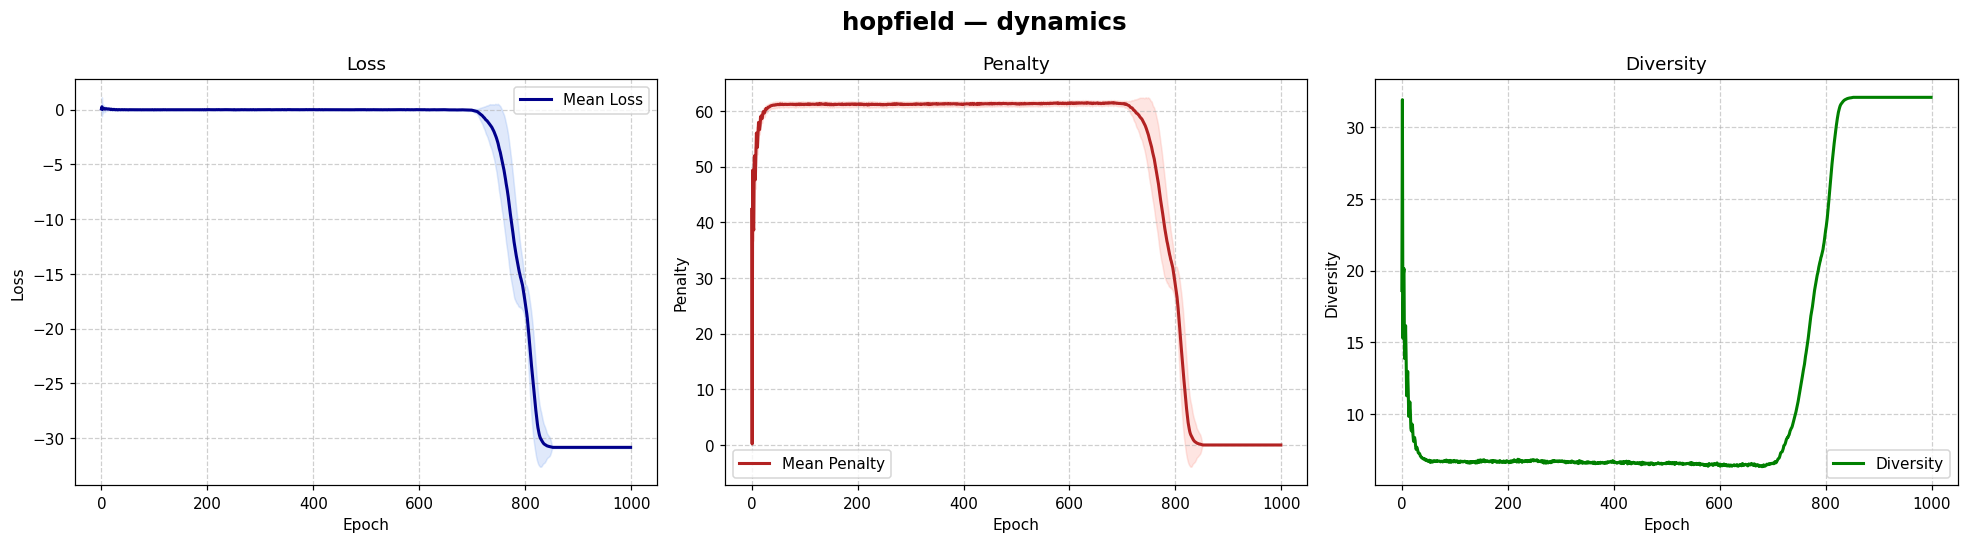 |
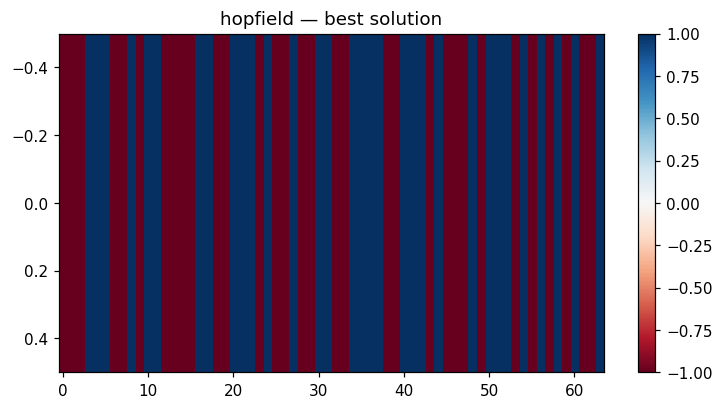 |
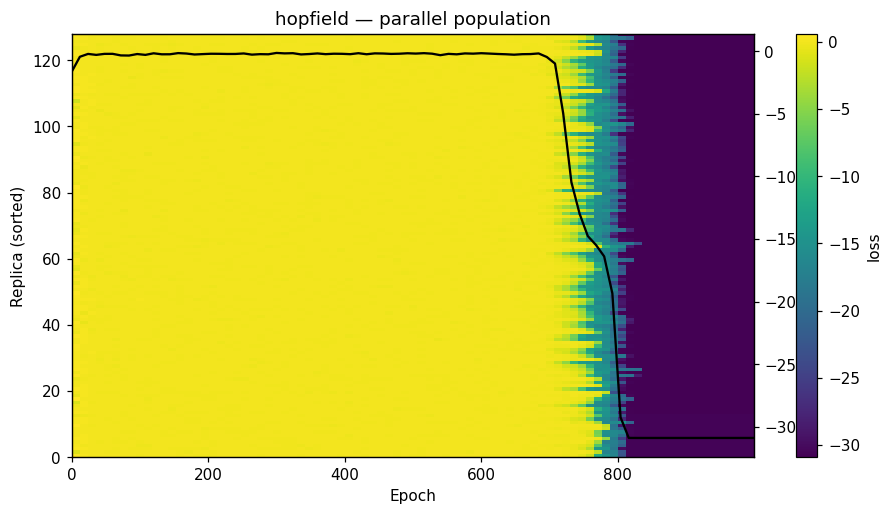 |
Regenerate with uv run python scripts/make_gallery.py.