Benchmark your method against QQA
This page is the zero-to-report guide for third parties who want to compare a new solver against the benchmark suite shipped with QQA4CO. No edits to the repo or knowledge of its internals are required.
Every benchmark instance lives on the Hugging Face Hub:
The dataset bundles the DISCS CO
benchmarks (NeurIPS 2023), the MaxCut G-set superset (71 graphs,
Helmberg & Rendl 2000 via Yinyu Ye's mirror), and four extra families
described in the PQQA paper:
Graph Coloring, MIS on d-regular random graphs, 3D Edwards-Anderson
spin glass and Balanced k-way partition.
1. One-command setup
That will fetch ~6.7 GB of DISCS subsets + the PQQA extras. Use the finer-grained flags if you only need one family:
2. One-line run
Three equivalent ways to run the benchmark:
All outputs land under ./bench_results/ (git-ignored by default), so
you can keep multiple runs side-by-side.
3. Visualise the result
For an A/B comparison against a baseline:
qqa bench-plot bench_results/mine.json bench_results/sa.json \
    --labels "my method" "SA baseline" \
    --title "My method vs SA" \
    --output report.png
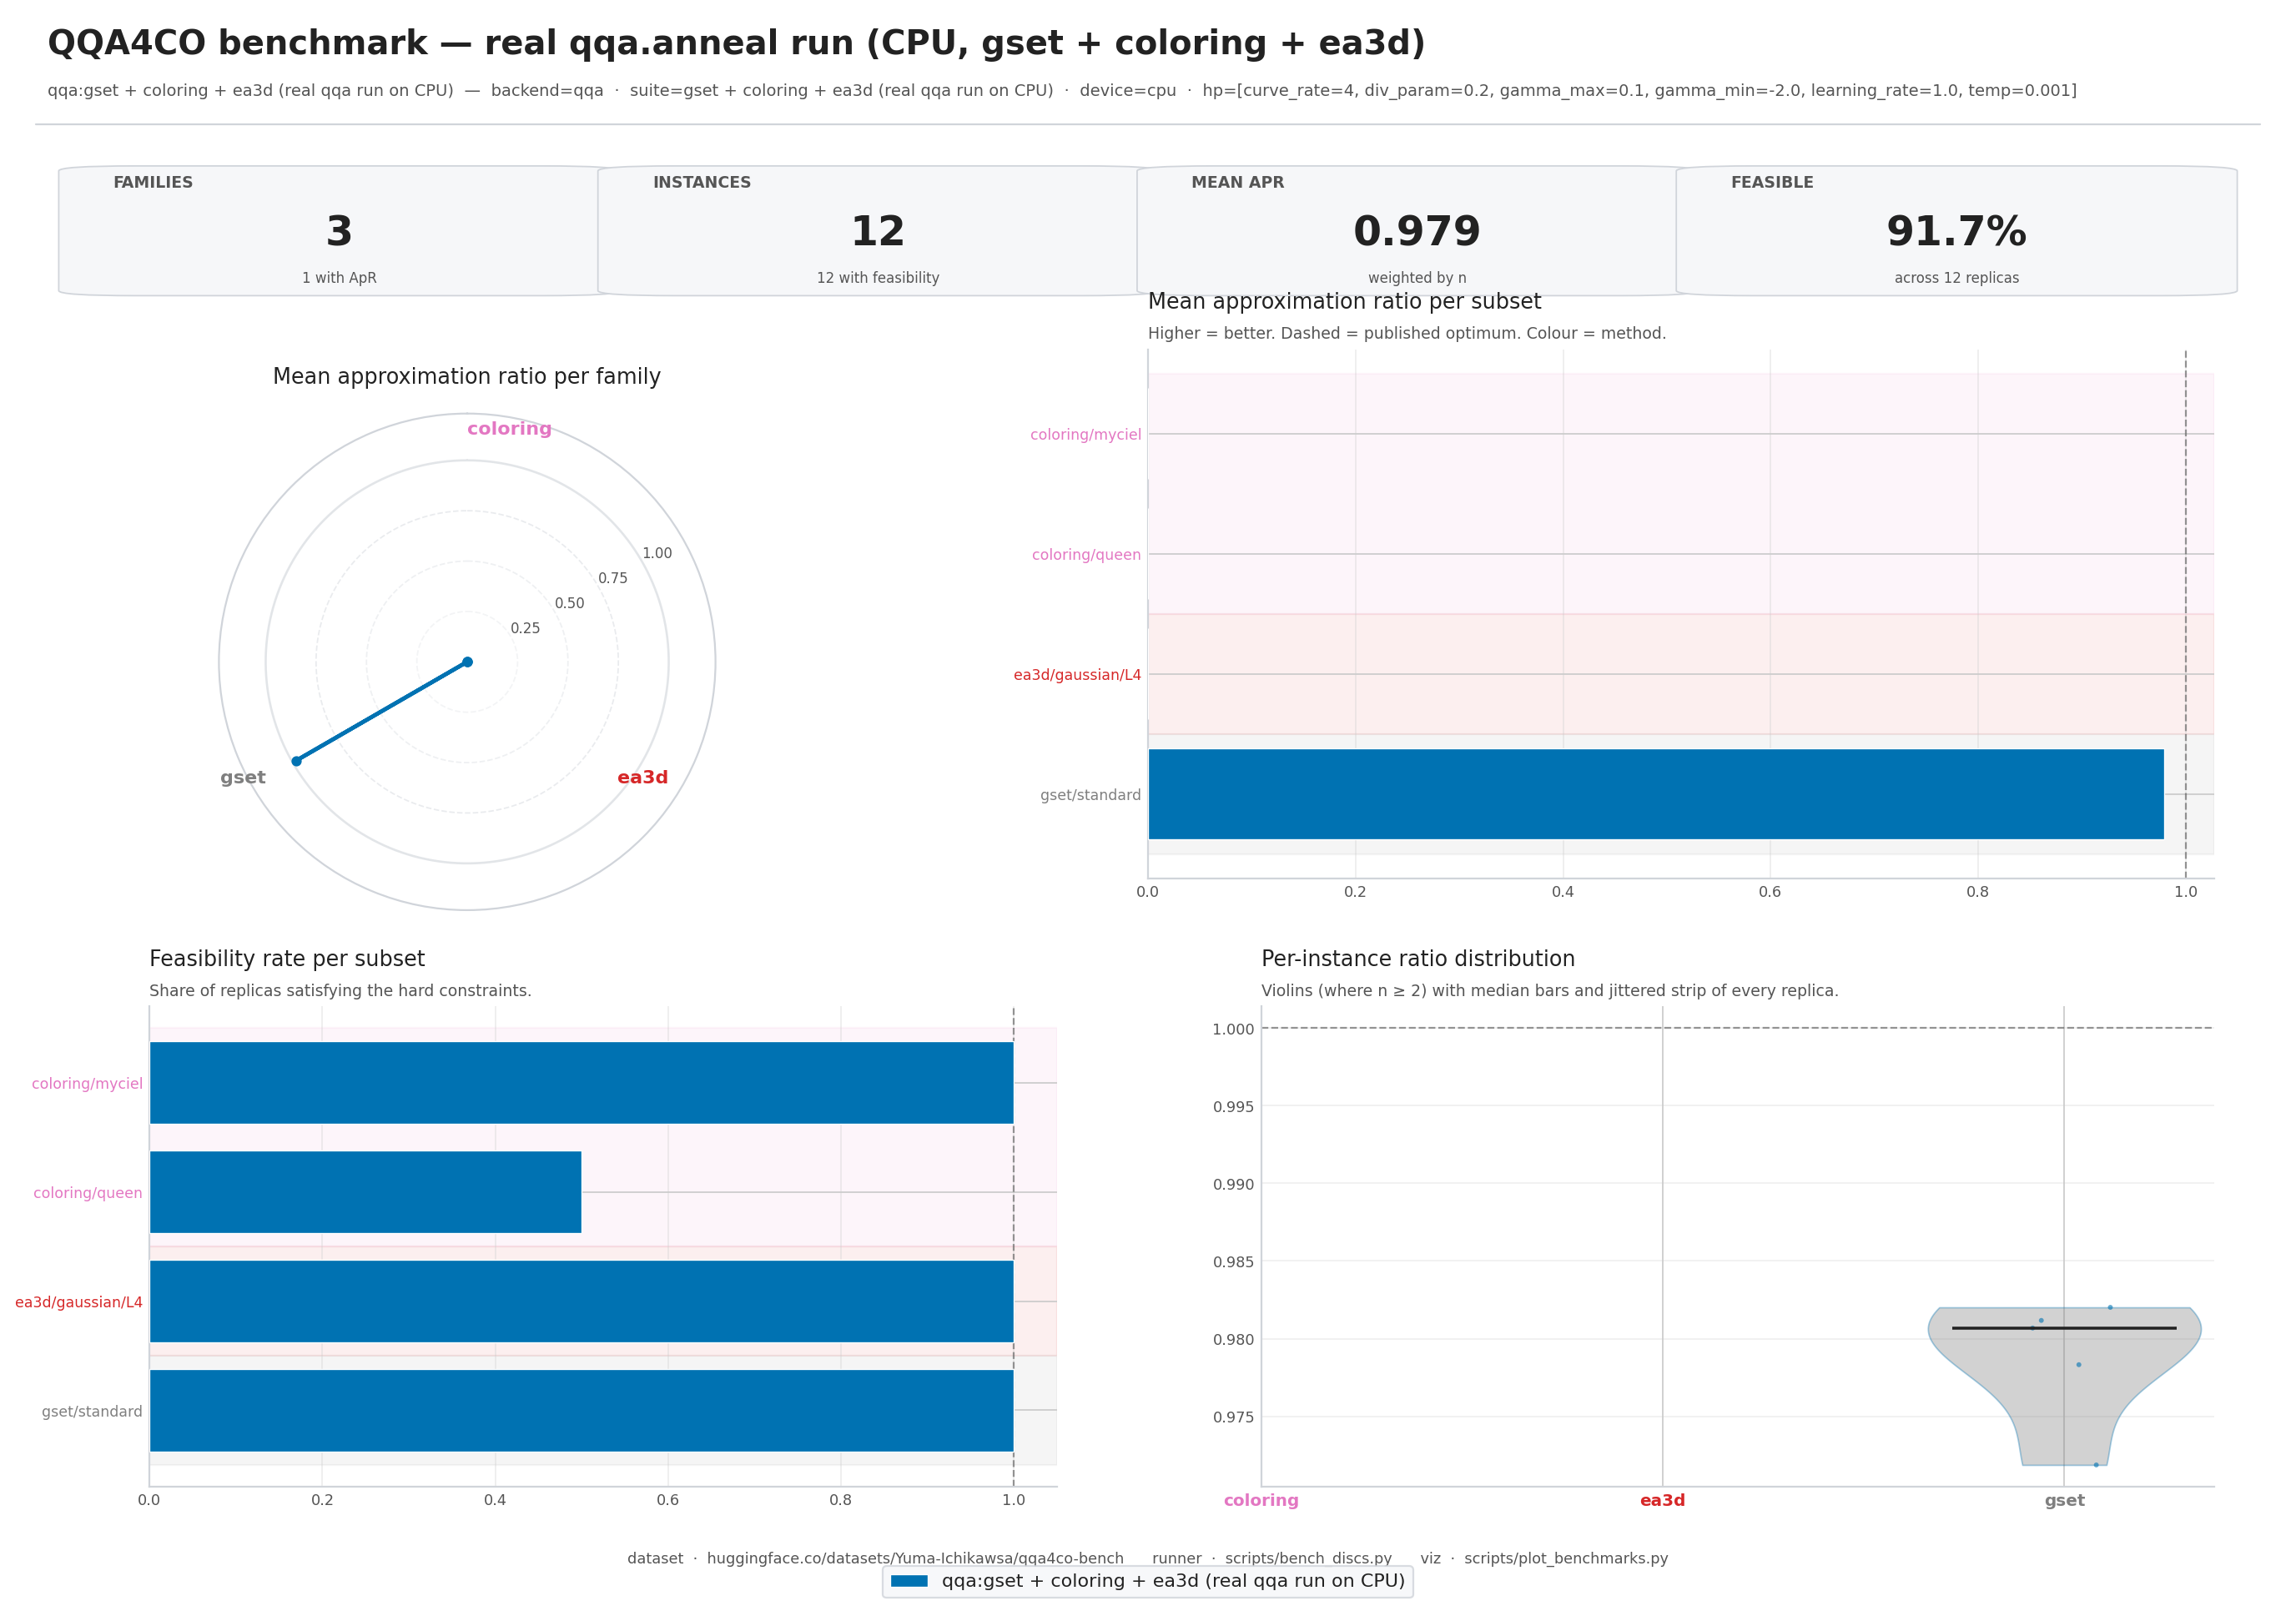
The rendered image is a single 2x2 panel — radar (per-family ratio),
per-subset horizontal bars, feasibility bars, and a per-instance
violin+strip plot. --theme dark produces a dark-mode variant suitable
for talk slides.
4. Suite identifiers
--suite accepts:
| Pattern | Example |
|---|---|
all |
every subset on disk |
<family> |
coloring, ea3d |
<family>-<graph-type> |
mis-rrg, ea3d-gaussian |
<family>-<graph-type>-<subset> |
ea3d-gaussian-L6 |
Family names themselves can contain a hyphen (mis-rrg,
balanced-partition); resolution is longest-prefix-first.
5. Reporting approximation ratios honestly
For each solver we report a single "higher-is-better" number. The
convention differs per family so that the ratio is always in
(0, 1] at the published optimum:
| Family | Objective | Ratio formula |
|---|---|---|
mis, mis-rrg |
maximisation | solver / best_known |
maxcut, maxclique |
maximisation | solver / best_known |
gset (MaxCut) |
maximisation | solver / best_known |
normcut |
minimisation | best_known / solver |
coloring |
conflict count | feasible flag only |
ea3d |
energy (≤ 0) | solver / best_known |
balanced-partition |
edge cut | feasibility only (no ref) |
qqa.bench.plot weighs each subset's mean ratio by the number of
instances it contains, so a family with multiple subsets stays
well-represented in the family-level radar.
6. Custom solver?
qqa.bench.run only routes through the three built-in backends
(qqa / sa / pa). To benchmark your own solver:
-
Load the exact instances the runner uses:
-
Dump your results in the same JSON schema as
scripts/bench_discs.pywrites (seescripts/bench_discs.pyfor the exact shape). Once written,qqa bench-plotwill happily render your results next to the bundled baselines.